
Description:
Discover the ideal size and layout for a control room. Learn how to optimize space, ergonomics, and operator workflow for maximum efficiency and comfort.
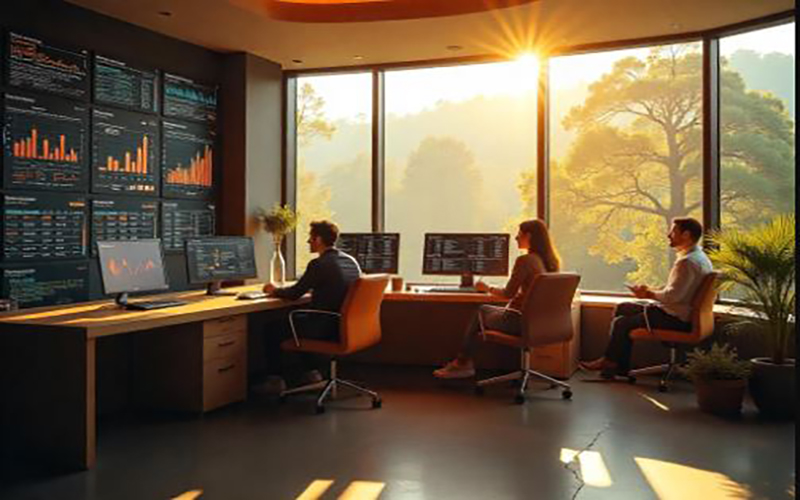
When it comes to building a control room, size and layout matter more than you think. Whether you’re designing a space for security surveillance, facilities management, or emergency response, the design will determine how your team communicates, interacts, and performs under pressure.
At Sage Control Room, we understand that control rooms aren’t just rooms filled with screens; they’re critical environments that require careful planning, ergonomic design, and flexibility to address future changes.
So, what is the ideal size and layout for a control room? Let’s explain.
What is the right size for a control room?
There’s no one-size-fits-all answer. The ideal size for a control room depends on:
Number of operators
Type of operations
Equipment and workstation requirements
Basic principles of ideal design
1. Operator-centric design
A good control room design prioritizes the operators.
2. Zoning for Functional Performance
Divide your room into functional zones
3. Efficient workflow and distribution
4. Sight lines and visual access
Each operator should have a clear, unobstructed view of the video wall or displays.
The Sage Control Room Approach
With over 30 years of experience, Sage Control Room in Dubai offers custom-designed, ergonomic, and future-proof control rooms for a variety of sectors.
What is real-time data visualization and why is it important?
Description:
Discover the power of real-time data visualization in control rooms. Learn how it can enhance decision-making, situational awareness, and drive operational excellence.
In a world where seconds make all the difference, access to real-time data is no longer a luxury; it’s a necessity. But raw data alone doesn’t tell the whole story. That’s where real-time data visualization comes in.
At Sage Control Room, we specialize in building advanced control room environments where real-time data visualization is at the heart of every decision. But what exactly is it, and why is it important?
What is real-time data visualization?
Real-time data visualization is the dynamic presentation of data as it’s being generated. Instead of waiting for reports or manually compiling statistics, decision makers can see what’s happening right now.
1. Instant Situational Awareness
Operators can instantly understand complex events with just a glance at a dashboard. This enables faster response and better coordination, especially in critical operations such as:
Facility control rooms
Emergency services
Airport and traffic management
Industrial automation
2. Better and faster decision-making
Visualizing live data trends allows teams to identify problems before they escalate, helping them make proactive rather than reactive decisions.
3. Improved collaboration
When multiple teams have access to the same visual data on a central video wall, communication improves, and collaborative decision-making becomes seamless.
4. Reduced human error
Visually presented data is easier to interpret and less susceptible to misreading than rows of numbers. This reduces the potential for costly human errors in high-pressure situations.
5. Scalability and customization
Modern visualization systems integrate with diverse data sources, such as IoT devices, servers, sensors, and third-party software. You can customize your view based on roles, departments, or specific KPIs.
At Sage Control Room, we design custom systems that integrate seamlessly with your operational environment, providing reliable, high-speed data visualization tailored to your needs.
In real-time visualization means real security.
In our fast-paced world, threats evolve by the second. With real-time visualization, you’ll always be one step ahead—detecting abnormal patterns, triggering alerts, and keeping your assets safe.
Based in Dubai, UAE, we’ve helped numerous industries transform their operations with advanced visualization systems that make their data work smarter, not harder.